
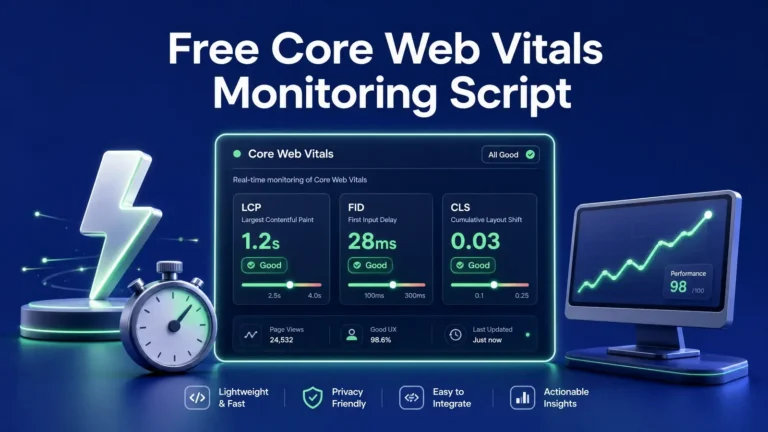
Free Core Web Vitals Monitoring Script
- ChatGPT
- Perplexity
- Claude
- Grok
Summarize this blog post with:
Core Web Vitals are an SEO ranking factor, since mid 2021.
But most teams only check them monthly and never against competitors.
You see your LCP is 2.4 seconds. And we congratulate yourself and your team! “Good”.
But you have no idea if your competitor improved to 1.8 seconds last week. You don’t know who’s winning on the metrics Google uses for ranking.
That’s not monitoring. That’s guessing.
Here’s the better approach: A free Google Apps Script that automatically collects Core Web Vitals data for your website and competitor websites every single day. No paid tools.
No monthly subscriptions. Just automated competitive intelligence.
What You'll Track (The Three Metrics That Matter)
Google reports six Core Web Vitals. Three are ranking factors:
- LCP (Largest Contentful Paint) — How fast your main content loads. Usually the biggest ranking impact.
- CLS (Cumulative Layout Shift) — Visual stability. High CLS means pages jump around during load (bad for ranking and UX).
- INP (Interaction to Next Paint) — How fast your site responds to clicks. Matters for interactive elements and checkout flows.
The script also tracks FCP, FID, and TTFB for complete visibility.
Why trends matter: Your competitor’s LCP improved 0.8 seconds this week. They rank higher next month. You find out when your traffic drops. Track trends daily instead.
What You Get
- Automated daily collection — Set once, runs forever
- Competitive benchmarking — Your site + unlimited competitors in one view
- Historical trending — See 30, 60, 90+ day performance shifts
- Google Sheets integration — Raw data you control
- No coding required — 5-minute setup
- 100% free — No SaaS, no subscriptions
By day 7: Week of comparative data.
By day 30: Real competitive trends emerge.
By day 90: Clear picture of your technical ranking position.
F
The Complete Core Web Vitals Playbook for 2026
Step-by-step strategies to hit green scores on LCP, INP & CLS — with real scripts, tools, and fixes used by top-performing sites.
How to Set It Up (5 Steps)
Step 1: Get Free API Access (3 minutes)
1.Go to https://console.cloud.google.com/
2. Create a new project
3. Search for “Chrome UX Report API”
4. Click Enable
5. Go to Credentials > Create API Key
6. Copy your key
Done. It’s free and takes 3 minutes.
What Your Data Looks Like
After one week of tracking, your LCP sheet will show this:
| Domain | Sat 18 Oct | Sun 19 Oct | Mon 20 Oc | Tue 21 Oc | Wed 22 Oc | Thu 23 Oc | Fri 24 Oc |
|---|---|---|---|---|---|---|---|
| your-store.com | 2800 | 2700 | 2600 | 2500 | 2400 | 2300 | 2200 |
| competitor-a.com | 2100 | 2100 | 2000 | 2000 | 1900 | 1900 | 1800 |
| competitor-b.com | 3400 | 3500 | 3400 | 3600 | 3400 | 3500 | 3500 |
What you can see immediately:
- Competitor A is faster than you by ~400ms and improving
- Competitor B is slower but unstable (3400—3600ms range)
- Your trend is positive (2800 → 2200ms over the week)
- You’re improving, but A is still ahead
Now multiply this by 30 days of data and you see real competitive positioning.
The Full "CWV vs Competition" App Script Code
/**
* ============================================================
* CHROME UX REPORT AUTOMATION SCRIPT
* ============================================================
*
* This Google Apps Script automatically fetches Chrome UX
* Report metrics for your domains and organizes them in a
* Google Sheet with historical tracking.
*
* SETUP REQUIRED:
* 1. Replace YOUR_API_KEY_HERE with your Chrome UX Report API key
* 2. Ensure you have a sheet named “A” with your domains in column A
* 3. Run the createSheetsAndAddData() function to start monitoring
*
* Author: Panos Kondylis, COO of Fussion
* ============================================================
*/
const API_KEY = “YOUR_API_KEY_HERE”;
const ENDPOINT = “https://chromeuxreport.googleapis.com/v1/records:queryRecord”;
function createSheetsAndAddData() {
const ss = SpreadsheetApp.getActiveSpreadsheet();
const source = ss.getSheetByName(“A”);
const domains = source.getRange(“A2:A”).getValues().flat().filter(Boolean);
domains.forEach((domain) => {
const data = fetchCWV(domain);
writeRow(ss, domain, data);
});
}
Troubleshooting (FAQs)
"No Data" for a Domain?
I Don't See Data After Running the Script
Double-check your API key is correct, that the Chrome UX Report API is enabled in Google Cloud, and that your domains are listed in column A of sheet “A”. The script logs errors to the Apps Script execution log.
Script Runs But Only Updates Some Domains
• The Chrome UX Report API has rate limits (150 requests/minute)
• If you have 30+ domains, run earlier or split into two sheets
• The script continues where it left off on the next run
Want Help Beyond Core Web Vitals Tracking?
- This free script gets you competitive visibility on Core Web Vitals. If you want to go deeper—including automated infrastructure optimization, ranking correlation analysis, and ongoing performance improvement—we can help.
- We work with ecommerce brands, SaaS companies, and media properties to engineer technical performance as a competitive advantage.
P
Panos Kondylis
For over 20 years, I’ve worked with ambitious teams to help them unlock scalable growth. From eCommerce scaleups to early-stage startups, I’ve helped shape growth strategies that really move the needle. Performance, automation, experimentation: whatever it takes to unlock real momentum. At Fussion, we didn’t set out to become “just another digital agency.” We built something we had as marketers: a team that actually gets it.
Table of Contents
Free CWV Playbook
Everything you need to hit green scores across LCP, INP, and CLS in 2026.
What to read next


Get a Free Growth Discovery Call
- A full review of your current marketing efforts and effectiveness
- Evaluation of your marketing ROI and identification of growth opportunities
- Website performance opportunities & status (SEO, UX, Page Speed)
spitishop
ÄLE
T
workearly
Book a call with us